. 2019 May 22;10(23):5884–5892. doi: 10.1039/c9sc01218d

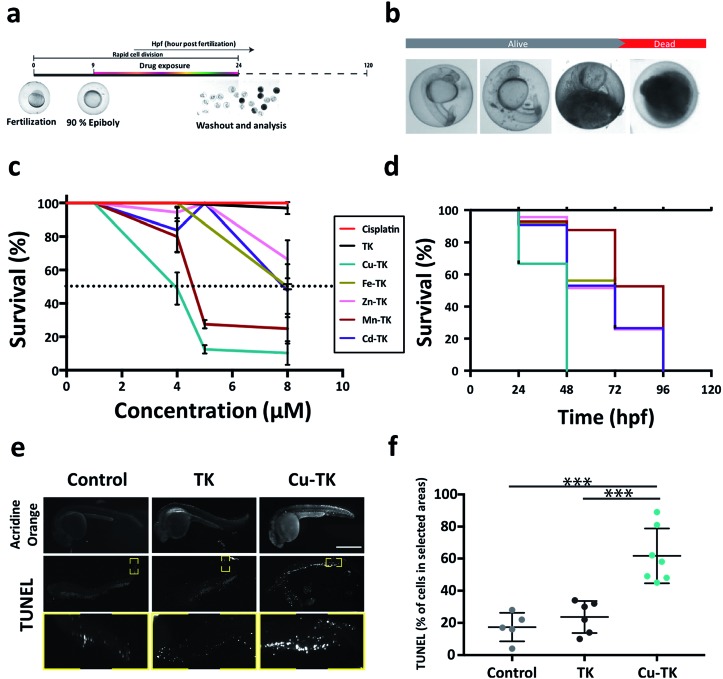
Fig. 3. M-TKs induce apoptosis in zebrafish embryos. (a) Treatment timeline for zebrafish embryos. (b) Sequence of death in 24 hpf live zebrafish embryos post treatment with M-TKs. (c) Dose–response curve for M-TKs, cisplatin, and metal-free TK. Dotted line indicates LD50. (d) Kaplan–Meier plot displaying the survival trend after treatment with M-TKs, cisplatin, and metal-free TK at a fixed concentration of 4 μM. (e) Representative images of control, TK- and Cu-TK-treated embryos. Top row – acridine orange assay. Middle row – TUNEL assay. Yellow boxes indicate area analyzed for TUNEL-positive cells. Bottom row – higher magnification inserts corresponding to the yellow boxes in the middle row. (f) Quantification of TUNEL-positive cells in control, TK-, and Cu-TK-treated zebrafish embryos. All values are expressed as mean ± STD. (n = 3). *P < 0.05, **P < 0.01 and ***P < 0.001 compared to the control.

Fig. 3