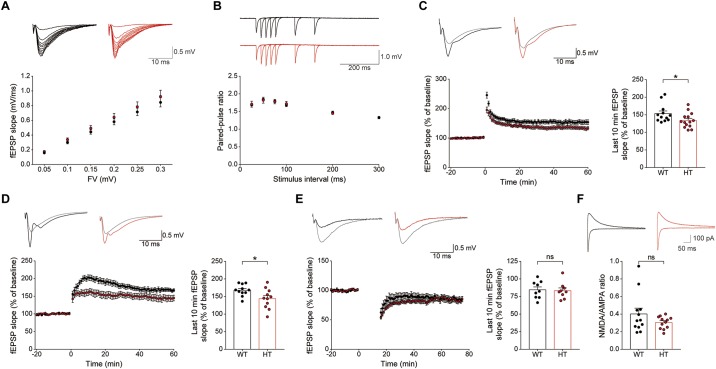
FIGURE 4.
Scn2a+/- mice display suppressed LTP, but normal LTD. (A) Normal basal excitatory synaptic transmission at hippocampal SC-CA1 synapses in Scn2a+/- mice (P20–22), as shown by the input–output ratio of fEPSP slopes plotted against fiber volley (FV) amplitudes. Data are presented as means ± SEM. n = 10 slices from 3 mice for WT and HT, two-way ANOVA with Sidak’s multiple comparison test. (B) Normal paired-pulse facilitation at hippocampal SC-CA1 synapses of Scn2a+/- mice (P20–22), as shown by fEPSP slopes plotted against inter-stimulus intervals. n = 10 slices from 3 mice for WT and HT, two-way ANOVA with Sidak’s multiple comparison test. (C) Decreased LTP induced by high-frequency stimulation (100 Hz, 1 s) at hippocampal SC-CA1 synapses of Scn2a+/- mice (3 months). n = 12 slices from 6 mice for WT and 14 slices from 7 mice for HT, ∗P < 0.05, Mann–Whitney test (last 10 min). (D) Decreased LTP induced by theta-burst stimulation (10 trains of 4 pulses at 100 Hz) at hippocampal SC-CA1 synapses of Scn2a+/- mice (3 months). n = 11 slices from 3 mice for WT and 11 slices from 4 mice for HT, ∗P < 0.05, Student’s t-test (last 10 min). (E) Normal LTD induced by low-frequency stimulation (1 Hz, 15 min) at hippocampal SC-CA1 synapses of Scn2a+/- mice (P17–23). n = 9 slices from 4 mice for WT and 9 slices from 5 mice for HT, ns, not significant, Student’s t-test (last 10 min). (F) Normal NMDA/AMPA ratio at hippocampal SC-CA1 synapses of Scn2a+/- mice (P21–25), as shown by the ratio of NMDAR- to AMPAR-mediated EPSCs. n = 12 cells from 5 mice for WT and 12 cells from 4 mice for HT, ns, not significant, Mann–Whitney test.

