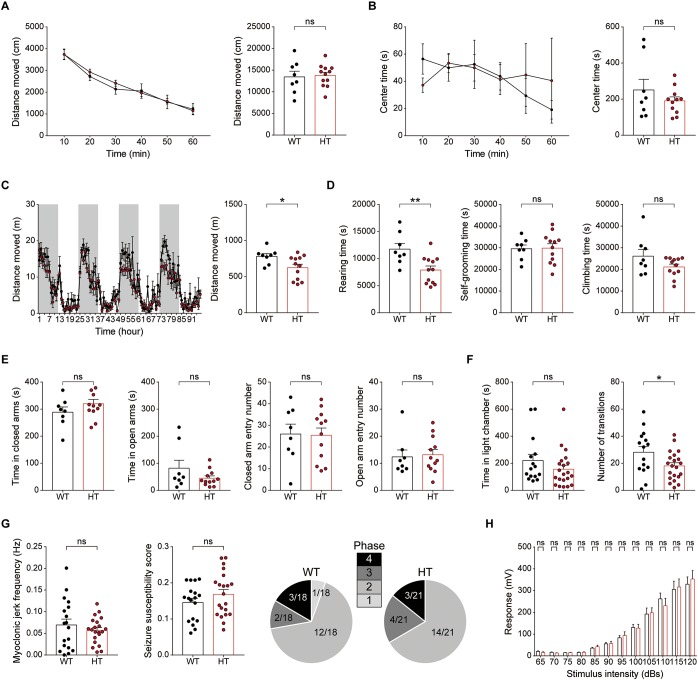
FIGURE 7.
Scn2a+/- mice show suppressed locomotion in a familiar environment, but normal anxiety-like behavior and susceptibility to induced seizure. (A,B) Normal locomotor activity of Scn2a+/- mice (2–3 months) in the open-field test. Data are presented as means ± SEM. n = 8 mice for WT and 11 for HT, ns, not significant, Two-way ANOVA with Sidak’s multiple comparison test, Student’s t-test and Mann–Whitney test. (C,D) Decreased distance moved and rearing time, but normal self-grooming and climbing, in Scn2a+/- mice (2–3 months) in the LABORAS test, in which mouse movements are continuously monitored for four consecutive days. Note that the extent of the decrease in distance moved became more evident as the time in LABORAS cages increased. The shaded regions indicate light-off periods. n = 8 mice for WT and 12 for HT, ∗P < 0.05, ∗∗P < 0.01, ns, not significant, two-way ANOVA with Sidak’s multiple comparison test, and Student’s t-test. (E) Normal anxiety-like behavior of Scn2a+/- mice (2–3 months) in the elevated plus-maze test, as shown by time in closed/open arms and number of entries into each arm. n = 8 mice for WT and 12 for HT, ns, not significant, Student’s t-test and Mann–Whitney test. (F) Normal anxiety-like behavior of Scn2a+/- mice (2–3 months) in the light–dark chamber test, as shown by time spent in the light chamber. Note that the number of transitions into the light chamber was decreased, indicative of mild hypoactivity in the light–dark apparatus. n = 15 mice for WT and 21 for HT, ∗P < 0.05, ns, not significant, Mann–Whitney test and Student’s t-test. (G) Normal susceptibility to PTZ-induced seizures in Scn2a+/- mice (4 months), as shown by myoclonic jerk frequency, seizure susceptibility score, and terminal seizure stage reached. n = 18 mice for WT and 21 for HT, ns, not significant, Student’s t-test, and Chi-square test. (H) Normal acoustic startle response of Scn2a+/- mice (2–3 months), as shown by the responses to different intensities of acoustic stimuli. n = 13 mice for WT and 10 for HT, ns, not significant, two-way ANOVA with Sidak’s multiple comparison test.

