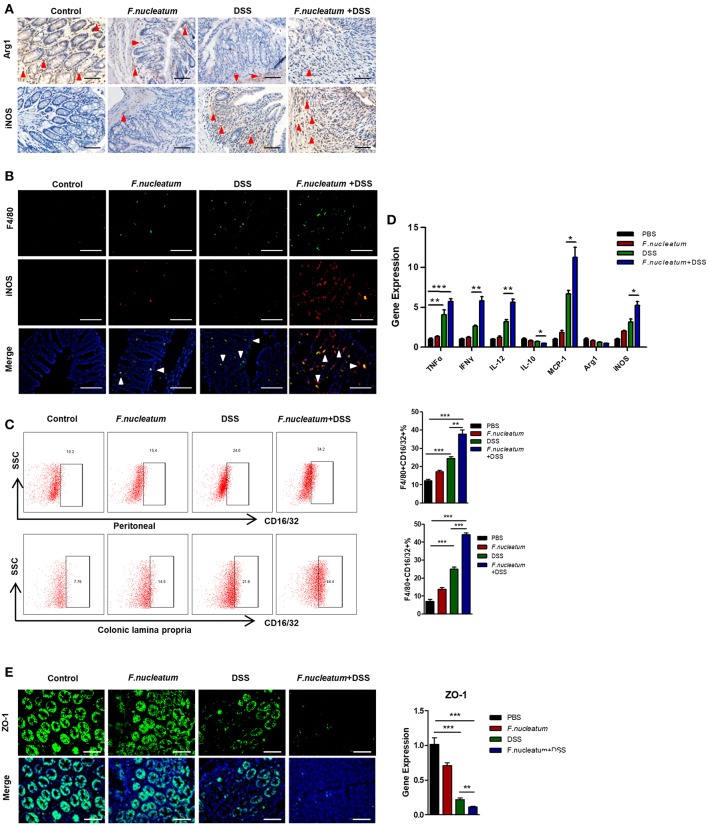
Figure 3.
F. nucleatum induces M1 macrophage infiltration and activation in colitic mice. (A) Representative images of colon Arg1 and iNOS levels measured by IHC. Scale bars, 25 μm. (B) Sections of colon tissues were immunostained with F4/80 (green) and iNOS (red) macrophages; DAPI (blue) served to stain nuclei. Representative images are shown. Scale bars, 50 μm. (C) Peritoneal and LP cells were stained with F4/80 and CD16/32 and assessed by flow cytometry. The ratios of F4/80 and CD16/32 positive cells are shown. (D) TNF-α, IFN -γ, IL-12, IL-10, MCP-1, Arg-1, iNOS, and ZO-1 were measured by qRT-PCR in colon tissue samples. (E) Sections of colon tissues were immunostained with ZO-1 (green) and DAPI (blue) from each group. Representative images are shown. Scale bars, 10 μm. Each experiment was performed at least three times. Data are presented as means ± SD. *P < 0.05; **P < 0.01; ***P < 0.001; Analysis of Variance (ANOVA) and Student's t-test (two-tailed).

