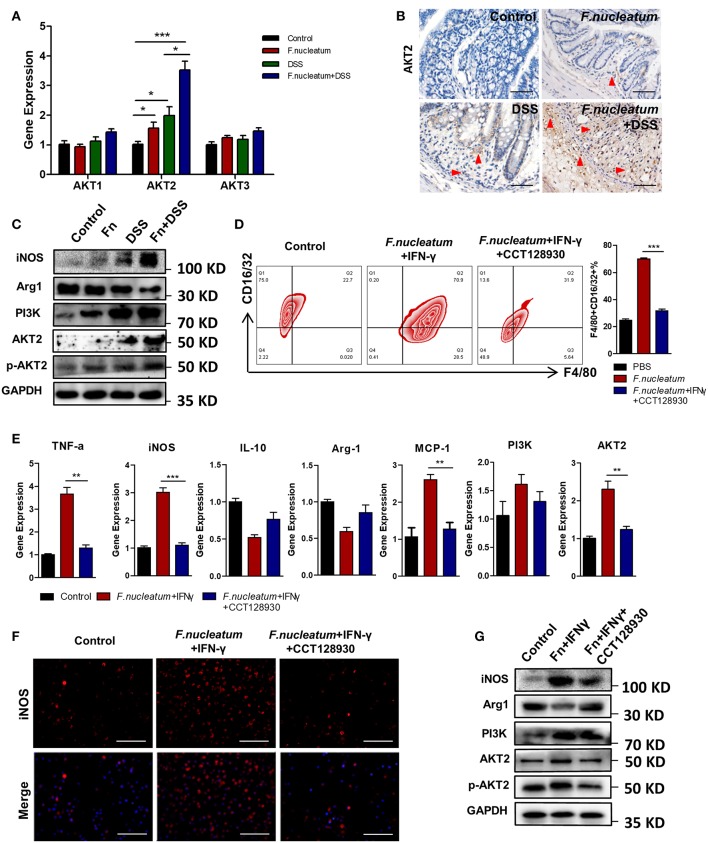
Figure 5.
F. nucleatum promotes M1 polarization via AKT2 signaling. (A) AKT1, AKT2, and AKT3 expression measured by qRT-PCR. (B) Representative colon images of AKT2 IHC staining. Representative images are shown. Scale bars, 25 μm. (C) iNOS, Arg1, PI3K, AKT2, phospho-AKT2, and GAPDH levels measured by Western blot. (D) BMDMs F4/80 and CD16/32 staining by flow cytometry. Ratio of F4/80 and CD16/32 double positive cells were performed. (E) M1 markers, TNF-α and iNOS; M2 markers, IL-10; and Arg-1, as detected by qRT-PCR. (F) BMDMs were immunostained with iNOS (red) and DAPI (blue) from each group. Representative images are shown. Scale bars, 50 μm. (G) iNOS, Arg1, PI3K, AKT2, phospho-AKT2, and GAPDH as measured by Western blot. Each experiment was performed at least three times. Data are presented as means ± SD. *P < 0.05; **P < 0.01; ***P < 0.001; Analysis of Variance (ANOVA) and Student's t-test (two-tailed).

