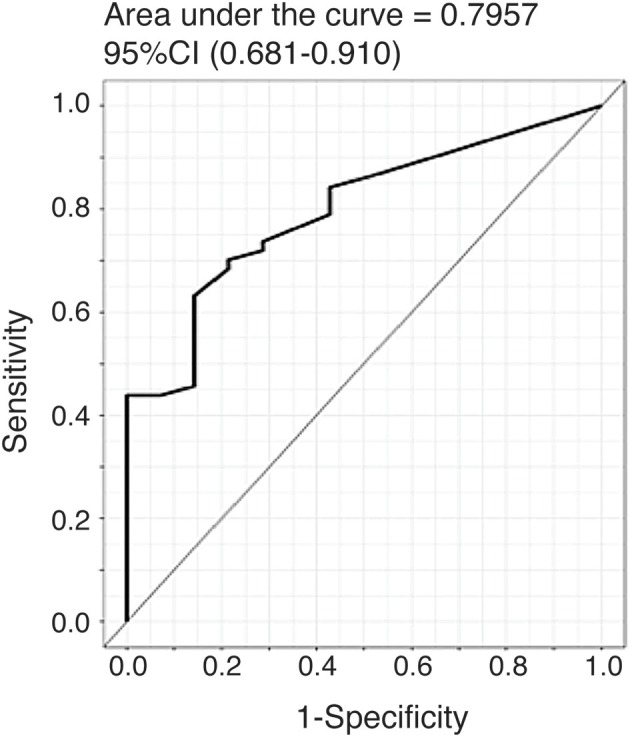
Figure 3.

ROC curve for the risk prediction model. Receiver operating characteristic (ROC) curve analysis to assess the association of plasma CTHRC1 levels with RA vs. healthy status. The area under the curve was 0.796 for log(CTHRC1) (p = 0.032). Plots indicate individual protein abundances in patients.
