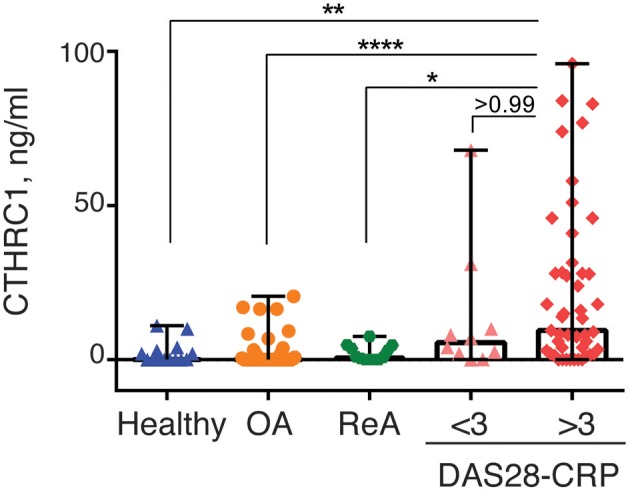
Figure 4.

CTHRC1 plasma levels correlate with the arthritis severity score. CTHRC1 levels were calculated separately for healthy control (green circles) and OA (blue squares) groups, as well as for RA patients with a DAS28-CRP score <3 (<3, orange triangles), and >3 (>3, red diamonds). Each colored circle, square, triangle, or diamond corresponds to one patient in each group. Box-and-whisker plot shows the median CTHRC1 levels within interquartile range and Tukey fences at 1.5 × IQR. Statistically significant differences between RA groups vs. healthy controls and the OA patient cohort are indicated with asterisks: **p < 0.01, ****p < 0.0001, Kruskal-Wallis with Dunn's post-hoc test and Bonferroni adjustment; *p < 0.05, Kruskal-Wallis test.
