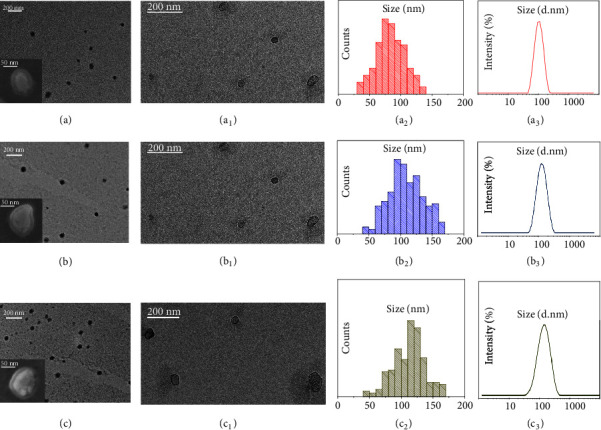
Figure 1.

Analysis of morphology and size distribution of freshly isolated sEVs performed by TEM, SEM, and DLS investigation. Representative TEM micrographs obtained with positive (a, b, c) and negative (a1, b1, c1) staining of sEVs extracted from plasma of the healthy donors (a, a1) and the CRC (b, b1) and GC (c, c1) patients, along with their corresponding SEM images (Inset a, b, c). Related size distributions by TEM (a2, b2, c2) and DLS (a3, b3, c3) analysis.
