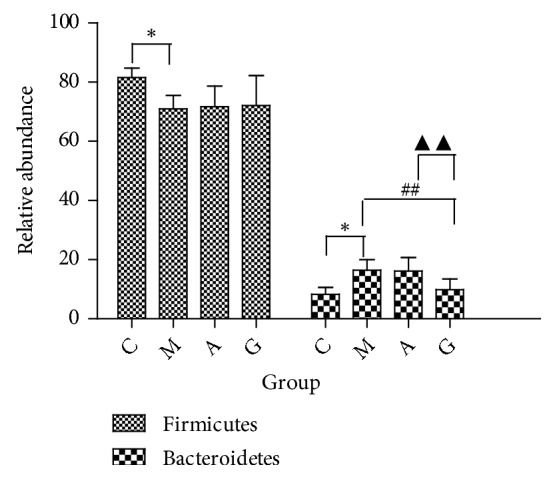
Figure 12.

Relative abundance of bacterial phyla detected in faecal samples. ∗P<0.05 vs the C group; ##P<0.01 vs the M group; ▲▲P<0.01 vs the A group.

Relative abundance of bacterial phyla detected in faecal samples. ∗P<0.05 vs the C group; ##P<0.01 vs the M group; ▲▲P<0.01 vs the A group.