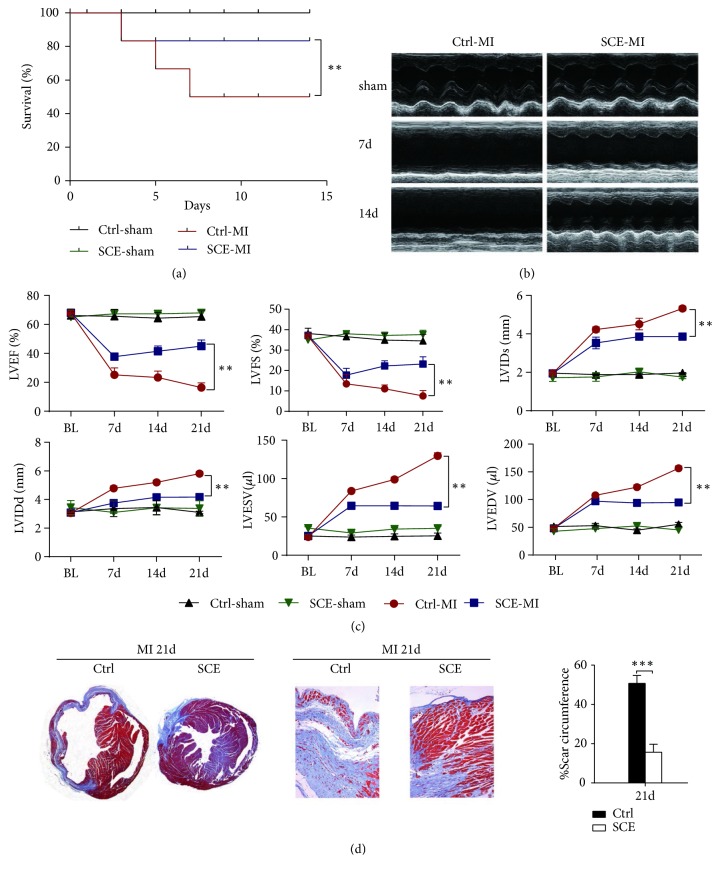
Figure 1.
SCE treatment improves survival and cardiac function and reduces fibrosis size in mice after MI. (a) Survival curve for MI mice treated with SCE (SCE + MI group, n = 17 mice; Ctrl + MI group, n = 20 mice). ∗∗P < 0.01, Student's t-test. (b) Representative M-mode images 21 days after MI. (c) Left ventricular ejection fraction (LVEF), left ventricular fractional shortening (LVFS), left ventricular internal dimension at end-systole (LVIDs), left ventricular internal dimension at end-diastole (LVIDd), left ventricular end-systolic volume (LVESV), and left ventricular end-diastolic volume (LVEDV) were quantified via echocardiography. Data represent the mean ± SEM (n = 10 mice per group). ∗∗P < 0.01, Student's t-test. (d) Left, representative Masson's trichrome staining of the coronal planes and the border zone 21 days following MI. Right, quantification of scar circumference in both the SCE group and the control group 21 days following MI. Data represent the mean ± SEM (n = 5 mice per group). ∗∗∗P < 0.001, Student's t-test.

