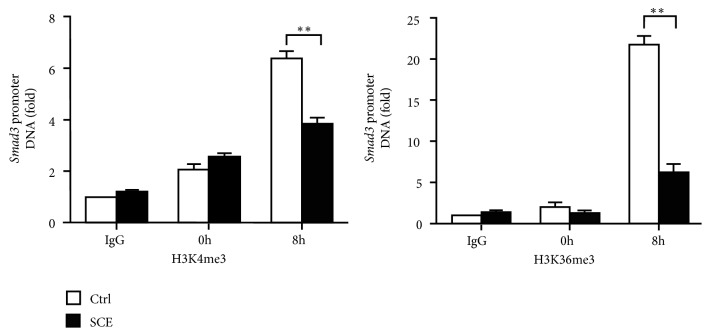
Figure 6.
SCE decreases the levels of H3K4me3 and H3k36me3 at the Smad3 promoter in CFs. ChIP-qPCR analysis of H3K4me3 or H3K36me3 level at the Smad3 promoter in CFs pretreated with SCE (10 μl/ml) followed by TGF-β (20 ng/ml) stimulation for the indicated times. IgG, control ChIP with immunoglobulin G. Data are from three independent experiments (mean ± SEM). ∗∗P < 0.01, Student's t-test.

