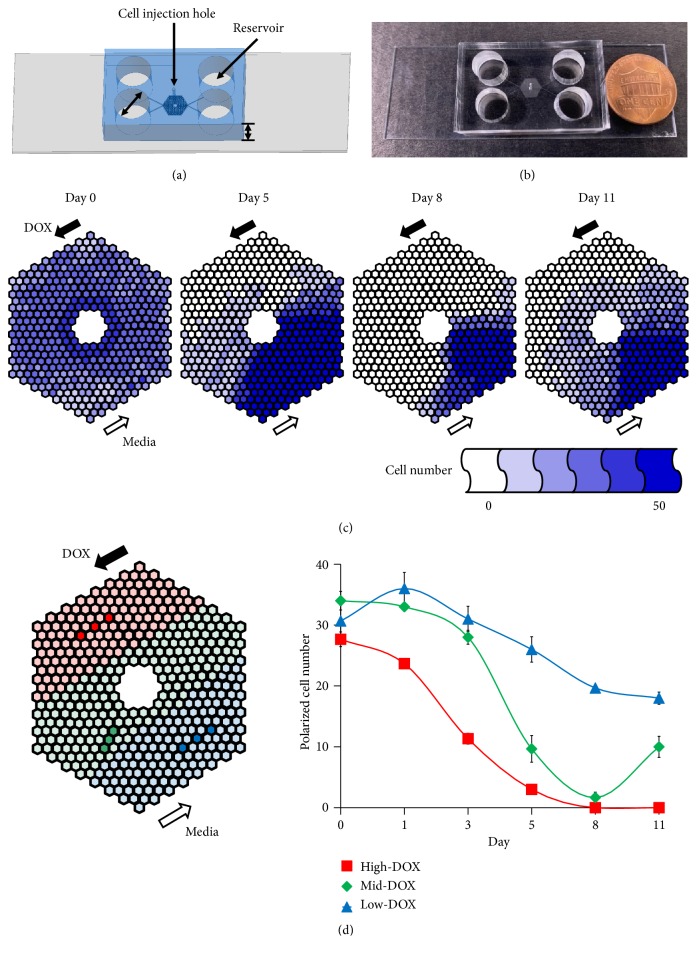
Figure 1.
Tracking DOX concentration-gradient induced resistant cells on the chip. Schematic figure (a) and real image (b) of a CDRA chip. (c) Tracking the number of live cells in each chamber of a CDRA chip for 11 days. (d) Average number of polarized cells in the three different DOX concentration regions (red (high), green (mid), and blue (low)) over 11 days.

