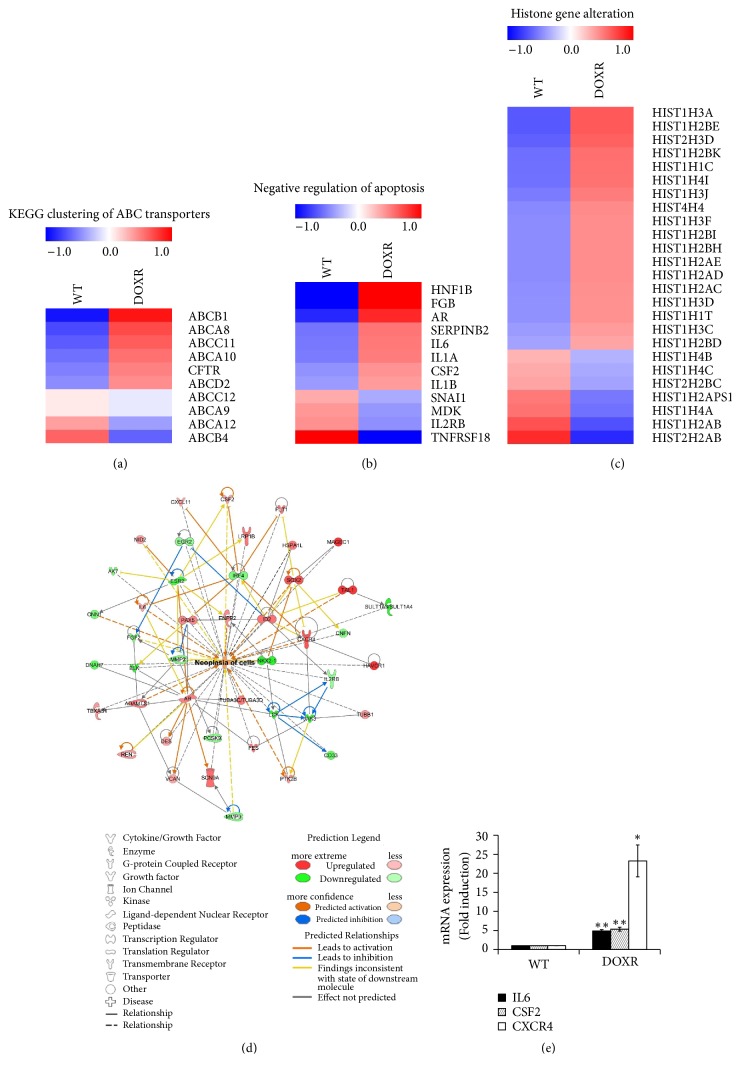
Figure 4.
RNA sequencing analysis of WT and DOXR cells. (a) KEGG clustering of ABC transporters. (b) Negative regulation of apoptosis. (c) Histone gene alteration. Genes with more than a 1.5-fold-change were selected. (d) IPA analysis of WT and DOXR cells. The analysis employed a fold-change cut-off value of ± 2. Red and green areas indicate metabolite concentrations that were increased and decreased compared to the WT group, respectively. Orange and blue areas indicate prediction as activation and inhibition, respectively. (e) qPCR validation of neoplasia-related gene expression. ∗p < 0.05, ∗∗p < 0.01, two-tailed Student's t-test.

