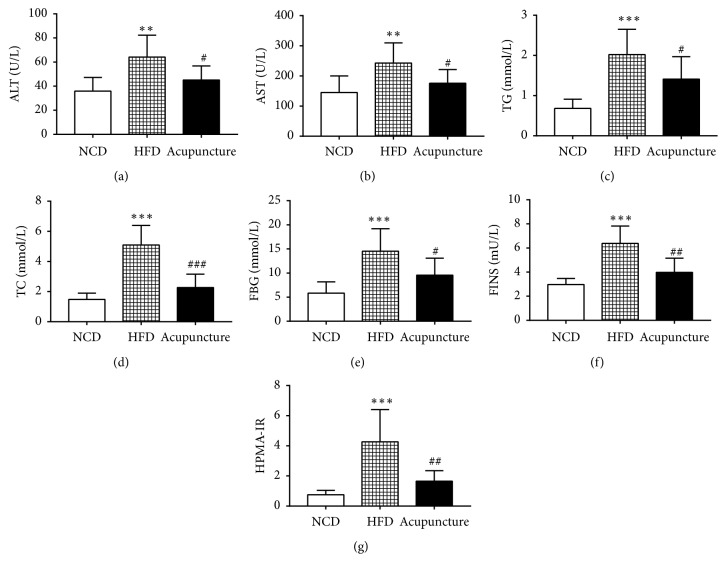
Figure 3.
Effects of acupuncture on metabolic parameters at week 8. (a) Changes in alanine aminotransferase (ALT) among NCD, HFD, and acupuncture groups (n=7 in each group). (b) Changes in aspartate aminotransferase (AST) among the three groups. (c) Variation in triglycerides (TG). (d) Variation in total cholesterol (TC). (e) Levels of fasting blood glucose (FBG). (f) The serum levels of fasting insulin (FINS). (g) The index of homeostasis assessment of insulin resistance (HOMA-IR). All data are expressed as mean ± SD. ∗P < 0.05, ∗∗P < 0.01, ∗∗∗P < 0.001, NCD vs. HFD; #P < 0.05, ##P < 0.01, HFD vs. acupuncture.

