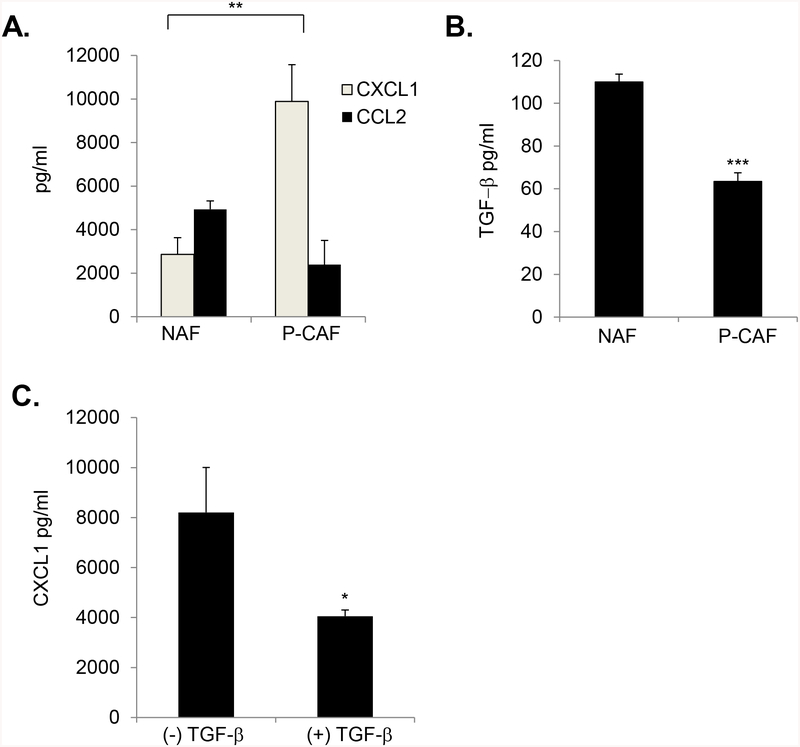
Fig 3. P-CAFs show increased CXCL1 and decreased TGF-β expression.
ELISA analysis of A. CXCL1 and CCL2 in NAFs vs. P-CAFs, B. TGF-β in NAFs vs. P-CAFs, C. CXCL1 in P-CAFs treated with 10 ng/ml of TGF-β for 24 hours. Statistical analyzed was performed using Two Tailed T-test. Samples were plated in triplicate per group. Experiments were performed three times. Statistical significance was determined by p<0.05. *p<0.05, **p<0.01, ***p<0.001. Mean±SEM are shown.

