
Figure EV2. Change in coefficient of variation (CoV) of gene expression data upon batch correction and denoising.
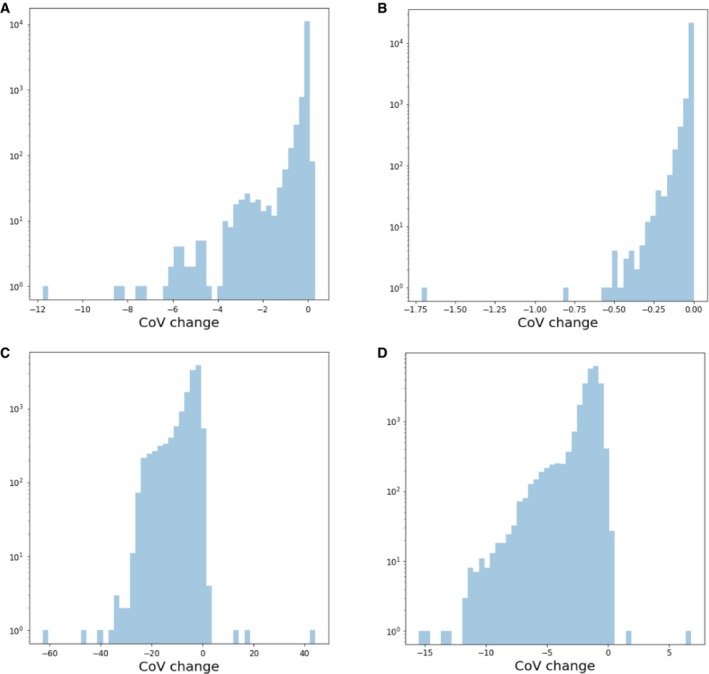
Negative values represent a reduction in CoV upon data correction. The top row shows CoV changes upon ComBat batch correction for (A) mouse intestinal epithelium (mIE) and (B) mouse embryonic stem cell (mESC) data. The lower row depicts CoV changes upon DCA denoising for (C) mIE and (D) mESC data. mIE data were obtained from Haber et al (2017) and mESC from Klein et al (2015).