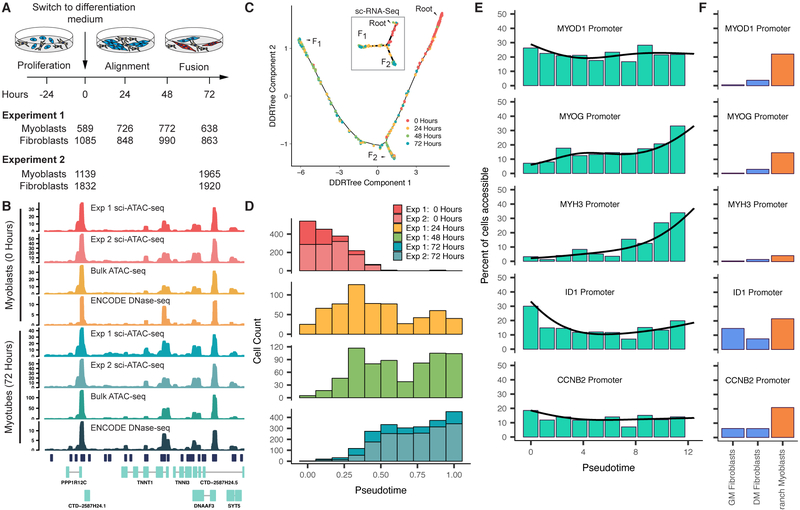
Figure 1.
Differentiating myoblasts follow similar single cell chromatin accessibility and gene expression trajectories. A) Single cell chromatin accessibility profiles for human skeletal muscle myoblasts (HSMM) were constructed with sci-ATAC-seq. Contaminating interstitial fibroblasts (common in HSMM cultures) were removed informatically prior to further analysis. B) Aggregated read coverage from sci-ATAC-seq experiments in the region surrounding TNNT1 and TNNI3 in myoblasts (0 hours) and myotubes (72 hours). Bulk ATAC-seq prepared from the same wells as experiment 2 are shown alongside DNase-seq from ENCODE for comparison (ENCODE experiments ENCSR000EOO and ENCSR000EOP (The ENCODE Project Consortium, 2012)). C) The single cell trajectory inferred from 2,725 myoblast sci-ATAC-seq profiles from experiment 1 by Monocle (see Methods). In subsequent panels and throughout the paper, we exclude cells on the branch to outcome F2 unless otherwise indicated. Inset shows the sc-RNA-seq trajectory reported for HSMMs (reproduced from Figure 2 of (Qiu et al., 2017a), cells were from the same lot and were cultured under identical conditions to those for sci-ATAC-seq). D) Distribution of cells in chromatin accessibility pseudotime from the root to trajectory outcome F1. E) Percent of differentiating cells whose promoters for selected genes are accessible across pseudotime. Black line indicates the pseudotime-dependent average from a smoothed binomial regression. F) Percent of cells whose promoters for selected genes in E are accessible in fibroblasts collected in growth medium (GM) or differentiation medium (DM), as well as myoblasts localized to the branch to F2. See also Figure S1.

