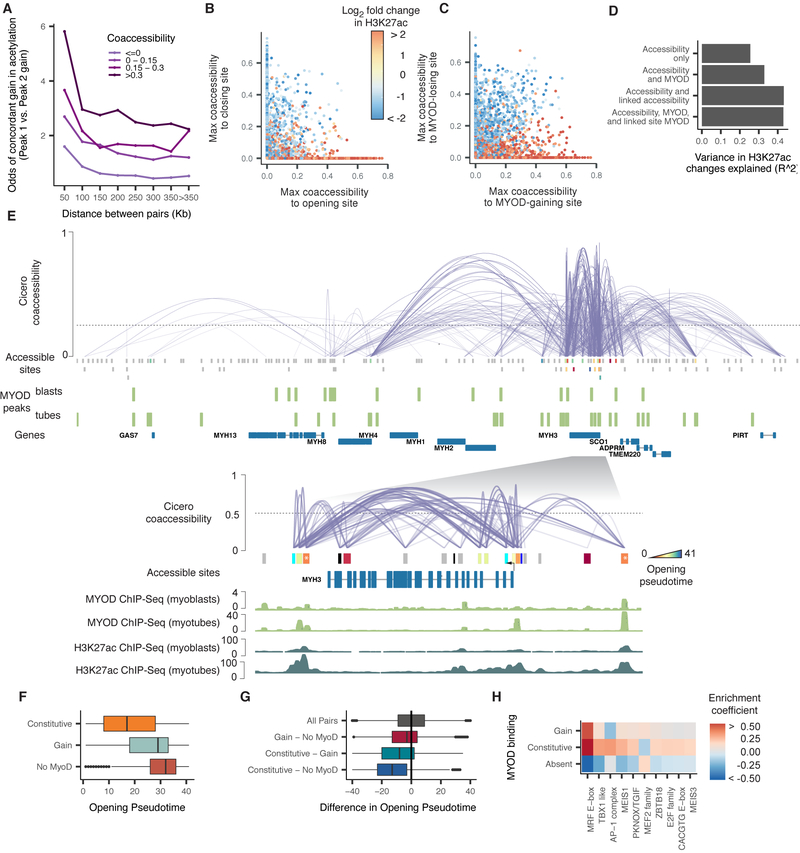
Figure 5.
Coaccessible DNA elements linked by Cicero are epigenetically co-modified. A) Odds ratio of a site gaining H3K27ac during myoblast differentiation, given that it is linked to a site that is doing so. Color indicates the strength of the Cicero coaccessibility links. The lightest color indicates pairs of sites that are unlinked by Cicero. B) Correspondence between a statically accessible site’s gain or loss of H3K27ac and its maximum coaccessibility score to a site that is opening (x axis) or closing (y axis). Sites that are not linked to an opening or closing site are drawn at x = 0 or y = 0, respectively. C) Similar to panel B, but describing the correspondence between a site’s gain or loss of H3K27ac and its maximum coaccessibility score to a site that is gaining or losing MYOD. D) The variance explained in a series of linear regression models in which the response is the log2 fold change in H3K27ac level of each DNA element and the predictors are whether that site is opening, closing, or static, whether it gains or loses MYOD binding, and whether it is linked to neighbors that are doing so. See Methods for details on model specifications. E) The Cicero map for the 755 kb region surrounding MYH3 along with called MYOD ChIP-seq peaks from (Cao et al., 2010). Sites opening in accessibility are colored by their opening pseudotime (see Methods), sites not opening in accessibility are shown in grey. The inset shows the 60 kb region surrounding MYH3 along with MYOD ChIP-seq and H3K27ac ChIP-seq signal tracks from (Cao et al., 2010) and (The ENCODE Project Consortium, 2012). Only protein-coding genes are shown. F) Opening pseudotimes for all opening sites, subdivided by whether MYOD is bound in myoblasts and myotubes, myotubes alone, or neither. G) The difference in opening pseudotimes between pairs of linked DNA elements. The pairs are grouped based on whether one or both sites is constitutively bound by MYOD. H) TF binding motifs selected by an elastic net regression (alpha = 0.5), with a response encoding the MYOD binding status of each site. See also Figure S6.

