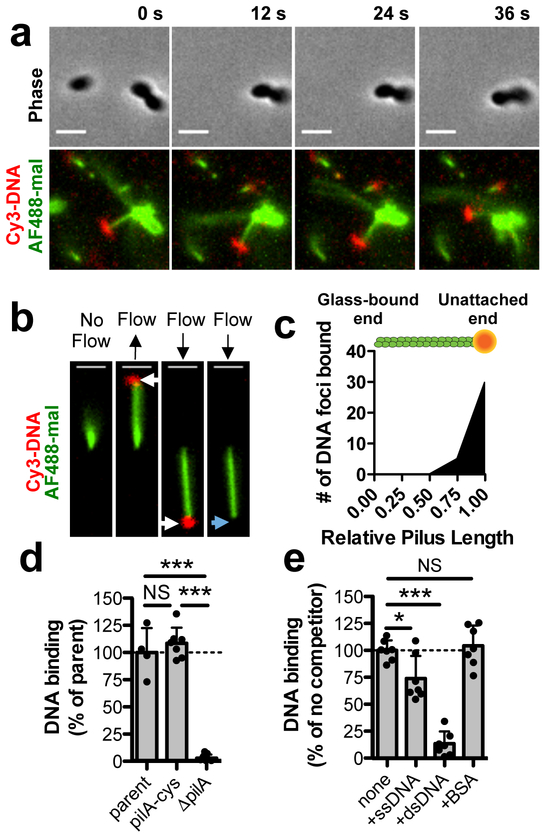
Fig. 1. The tips of type IV competence pili directly bind DNA.
Because type IV competence pili are dynamically active and relatively few pili are extended at any given time, all pilus-DNA binding studies were performed in ΔpilT backgrounds to ensure that cells contained numerous extended pili as shown in Supplementary Fig. 1c. (a) Montage of time-lapse imaging of a pilA-cys ΔpilT cell labeled with AF488-mal after mixing with Cy3-labeled DNA in a wet mount. Scale bar, 2 μm. (b) Example of a sheared pilus labeled with AF488-mal bound to glass within a microfluidic device after the addition of fluorescently labeled DNA. Before flow is applied, the relatively long pilus fiber is out of the field of view, but after flow is applied, bound DNA becomes apparent (white arrows) and moves with the direction of flow. When flow is maintained, the DNA detaches from the pilus fiber (blue arrow). Black arrows above images represent the direction of flow. Scale bar, 2 μm. Data in a-b are representative of 3 independent experiments. (c) Localization of bound DNA along sheared pili in microfluidic devices. Pili were normalized in length to 1.00 (arbitrary units), and the position of DNA foci bound along the length for each fiber was plotted, n = 51 independent DNA-bound pili analyzed. Green rod above plot is a visual representation of a labeled pilus fiber bound to orange DNA. (d) Relative DNA binding assay using a fluorescently labeled 6 kb PCR product. parent n = 4, pilA-cys n = 7, ΔpilA, n = 7. (e) Relative DNA binding as in d except with the addition of the indicated non-labeled competitors at 50-fold excess. Competitors were ssDNA (PhiX174 virion), dsDNA (PhiX174 RFII), or bovine serum albumin (BSA). n = 7 for all samples. Each data point in d-e represents an independent biological replicate and bar graphs indicate the mean ± SD. Statistical comparisons were made by two-tailed Student’s t-test. NS = not significant, *P < 0.05, ***P < 0.001.

