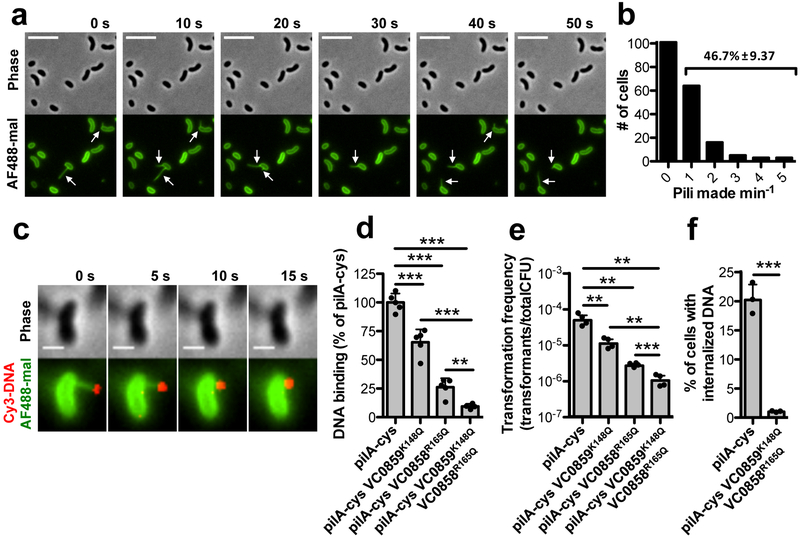
Fig. 2. Type IV competence pilus dynamic activity and DNA binding are critical for DNA internalization.
(a) Montage of time-lapse imaging of pilA-cys cells after labeling with AF488-mal dye. The white arrows indicate pili. Scale bar, 5 μm. (b) Number of cells making 0–5 pili within a one-minute period. Data are from three independent, biological replicates, n = 192 total pili observed. Percentage is the percent of cells within the population that make pili within the one-minute time-frame ± SD. (c) Montage of time-lapse imaging of a retracting pilA-cys strain after labeling with AF488-mal and incubation with fluorescently labeled DNA in a wet mount. Scale bar, 1 μm. Similar events were captured in three independent experiments. (d) Relative DNA binding assay of the indicated strains in ΔpilT mutant backgrounds using a fluorescently labeled 6 kb PCR product. (e) Natural transformation assays of the indicated strains. Cells were incubated with 5 ng of transforming DNA (tDNA) and DNase I was added to reactions after 10 mins to prevent additional DNA uptake. (f) DNA internalization assays of the indicated strains using a fluorescently labeled 6 kb PCR product. VC0858 and VC0859 encode minor pilins. Each data point in d-f represents an independent biological replicate (d-e, n = 4 for all samples; f, n = 3 for all samples) and bar graphs indicate the mean ± SD. All statistical comparisons were made by two-tailed Student’s t-test. **P < 0.01, ***P < 0.001.

