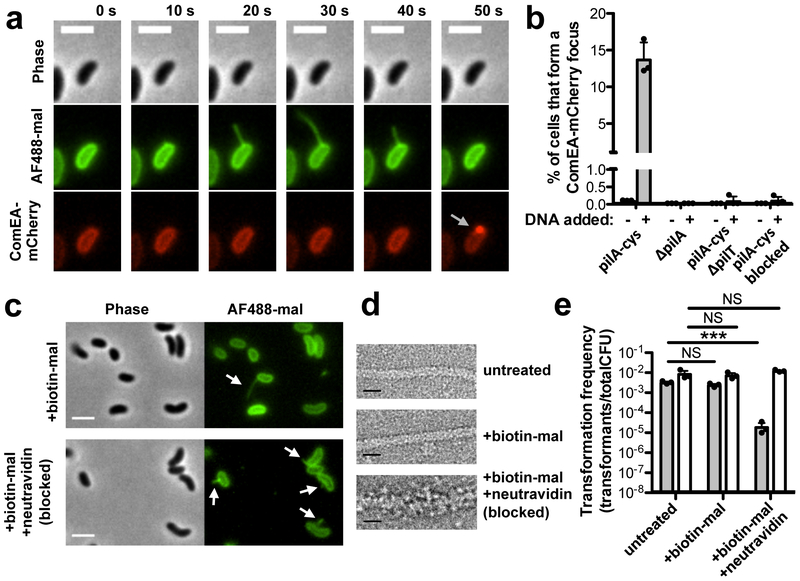
Fig 3. Pilus retraction is required for DNA uptake.
(a) Montage of time-lapse imaging of pilA-cys ComEA-mCherry strain labeled with AF488-mal showing ComEA focus formation after pilus retraction (gray arrow). Scale bar, 2 μm. (b) Percent of cells that formed a ComEA-mCherry focus within a five min window in the presence or absence of DNA. Cells that had already formed ComEA-mCherry foci at the start of imaging were excluded from the analysis. Data are from three independent experiments (n = 3 for each condition) and shown as the mean ± SD. (c) Static images of pilA-cys cells labeled with a 1:1 ratio of biotin-mal:AF488-mal with or without added neutravidin. White arrows indicate pili. Scale bar, 2 μm. (d) Transmission electron micrographs of pilA-cys pili with the indicated treatments. While untreated and biotin-mal treated pili exhibit a similar thickness, the biotin-mal + neutravidin treated pilus is approximately twice as thick. Scale bar, 10 nm. Images in c-d are representative of two independent experiments. (e) Natural transformation assays of pilA-cys (black bars) or parent (white bars) strains after the indicated treatment. Cells were incubated with 500 ng of tDNA and DNase I was added to reactions after 10 mins to prevent additional DNA uptake. Data are from three independent, biological replicates and shown as the mean ± SD. Statistical comparisons were made by two-tailed Student’s t-test. NS = not significant. ***P < 0.001.

