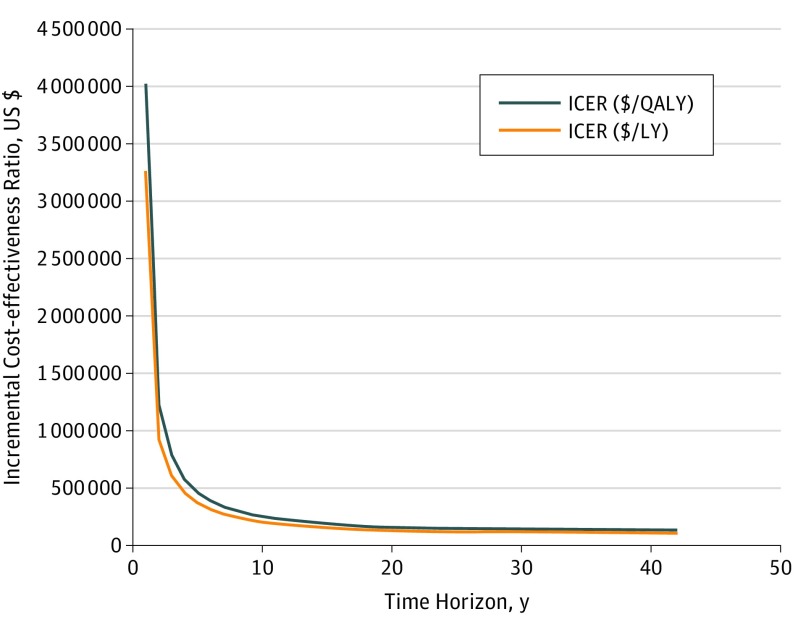
Figure 2. Incremental Cost-effectiveness Ratio (ICER) by Time Horizon.
The incremental cost-effectiveness ratio fell below $150 000 per QALY gained when the model time horizon was 7 years or longer. LY indicates life-year and QALY, quality-adjusted life-year. Cost-effectiveness was in 2017 US dollars.

