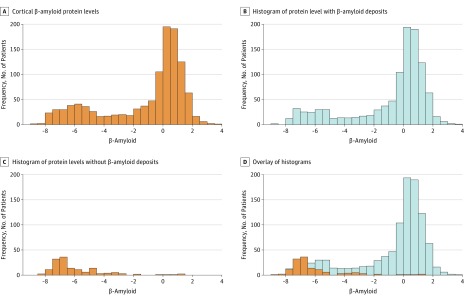
Figure 1. Distribution of Cortical β-Amyloid Protein Level.
A, The histogram reveals a bimodal pattern in the distribution of cortical β-amyloid protein level (n = 1203). B, A histogram of protein level with β-amyloid deposits (n = 1055). C, A histogram of protein level without β-amyloid deposits (n = 148). D, Overlays of B and C further illustrate that the higher peak was exclusively made up of individuals with β-amyloid deposits; almost all individuals without β-amyloid deposits were clustered in the lower peak.

