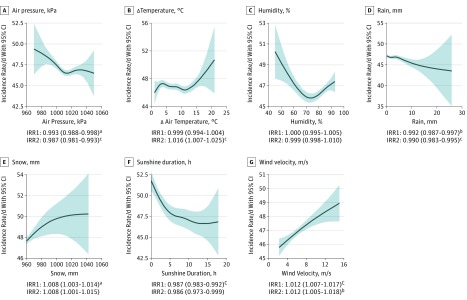
Figure 4. Nationwide Daily Incidence Rate of Myocardial Infarction by Air Pressure, Change in Temperature, Humidity, Precipitation, Sunshine Duration, and Wind Velocity.
Smoothed conditional mean plots visualizing the variation of incidence rates of myocardial infarction with 95% CI by different weather parameters. Unadjusted and adjusted incidence rate ratio (IRR) and 95% CI from regression analyses are presented with each graph. Results from the regression analyses are interpreted as change per increase in standard deviation. One standard deviation for air pressure, 10.9 kPa; change in temperature (Δ temperature), 3.4°C; humidity, 9.6%; rain, 2.6 mm; snow, 0.25 mm; sunshine duration, 4.2 hours; wind velocity, 1.9 m/s. IRR1 indicates univariable model; IRR2, multivariable model; NSTEMI, non–ST-elevation myocardial infarction; and STEMI, ST-elevation myocardial infarction.
aP < .05.
bP < .01.
cP < .001.

