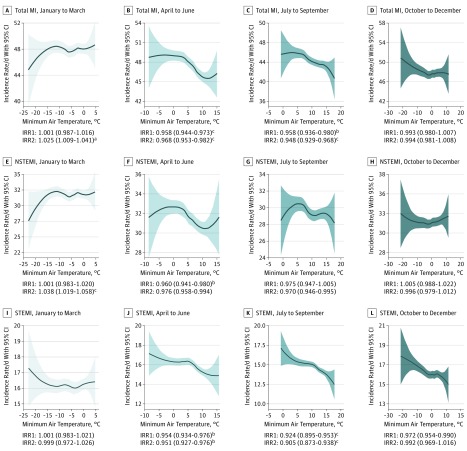
Figure 5. Nationwide Daily Incidence Rate of Myocardial Infarction (MI) by Air Temperature Stratified by Season of the Year.
Smoothed conditional mean plots visualizing the variation of nationwide daily incidence rates of MI at different temperatures by season. Unadjusted and adjusted incidence rate ratio (IRR) and 95% CI from regression analyses are presented. Results from the regression analyses are interpreted as change per increase in standard deviation. One standard deviation of air temperature in January through March, 5.2°C; April through June, 4.4°C; July through September, 3.1°C; October through December, 5.4°C. Seasonal analyses of remaining weather parameters are shown in eTable 3 in the Supplement. IRR1 indicates univariable model; IRR2, multivariable model; NSTEMI, non–ST-elevation MI; and STEMI, ST-elevation MI.
aP < .05.
bP < .01.
cP < .001.

