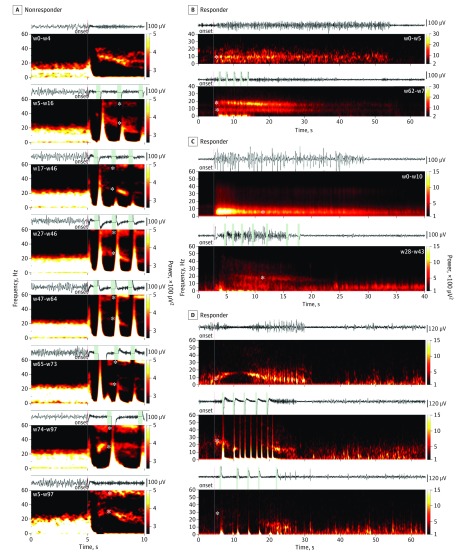
Figure 3. Direct and Indirect Frequency Modulation of Electrographic Seizure Patterns (ESPs).
A, Nonresponder’s ESP shows the 10 seconds centered on seizure pattern onset. A high- to low-beta (from 40 to 20 Hz) frequency band is systematically present at onset during baseline. During consecutive programming epochs, a progressive peristimulus attenuation of the initially dominant beta oscillation is seen, accompanied by progression of a novel gamma (55-60 Hz) oscillation (asterisks, weeks [w] 5-97). Both frequency bands appear concurrently in ESPs that were missed by stimulation throughout the stimulation periods. B, Responder’s ESP shows a baseline alpha-range (asterisk, 9-10 Hz) rhythm being replaced by a double band of independent theta and beta frequencies (asterisks, 6-10 Hz and 13-20 Hz, respectively). C, Responder’s ESP shows a semicontinuous progression of discharges in the delta to alpha range (asterisk, 2-10 Hz) and a newly appearing distinct subgroup of ESPs featuring a wide-band high-frequency distribution of epileptic oscillation (asterisk with range, 4-50 Hz). D, Responder’s electrographic seizures shows an arclike pattern in the delta to low-beta range (asterisk, 7-17 Hz) undergoing progressive changes in their onset spectral content during responsive neurostimulation treatment (asterisk, 20-36 Hz), evolving to diffuse spectrum low-power discharges (asterisk, 10-40 Hz). Vertical lines represent ESP onsets (red) and stimulation events (green).

