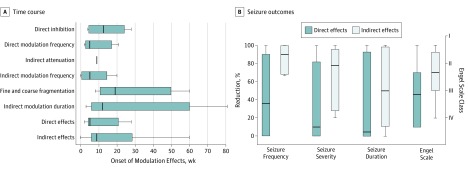
Figure 5. Electrographic Seizure Pattern Effects: Time Course and Association With Seizure Outcomes.
A, Onset of modulation effects in weeks after activation of the stimulation treatment. B, Percentages of the reductions in seizure frequency, severity, and duration compared with preimplantation baseline readings (left y-axis) and Engel scale scores (right y-axis) for patients having only direct effects and for those having indirect effects. The Engel scale consists of 4 classes (I-IV) in which lower numbers indicate greater improvement; class III or better defines a clinical responder. Internal line indicates median; box ends, first and third quartile; and limit lines, minimum and maximum values.

