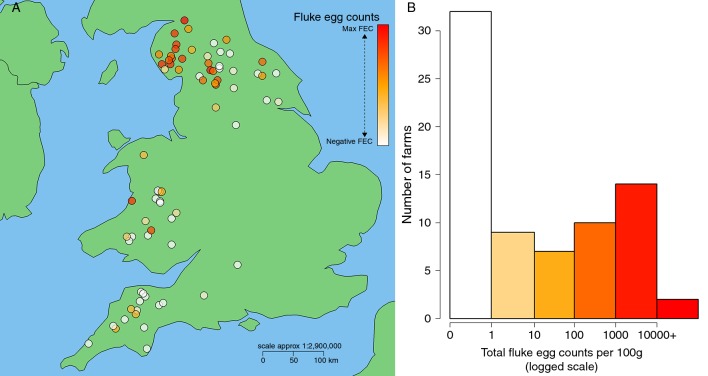
Figure 1.
Composite faecal egg counts per 100 g faeces showing (A) spatial distribution of individual farms sampled (n=74) and (B) range of recorded composite counts. Colour in both plots correspond to recorded egg counts per 100 g, with white signifying an egg count of zero and orange to red demonstrating the observed range in positive counts from 1 to 21,664 eggs per 100 g faeces. Spatial coordinates jittered 0.15o by 0.09o latitude/longitude (approximately 10 km2).

