
Figure 1.
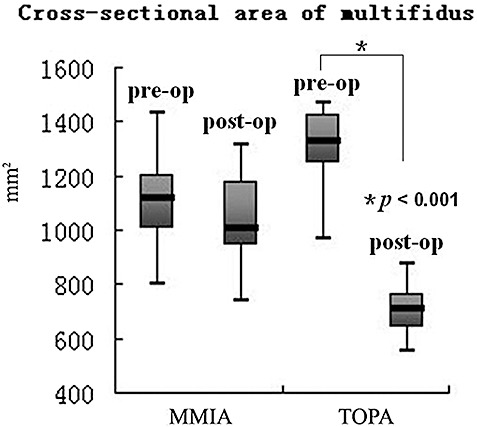
Box plot showing the longitudinal changes in CSA of the multifidus muscle in the MMIA and TOPA groups. Box plots show the median value (horizontal line in box), and the interquartile range (25%–75%) is represented by the box. Whiskers encompass the 5% to 95% range.