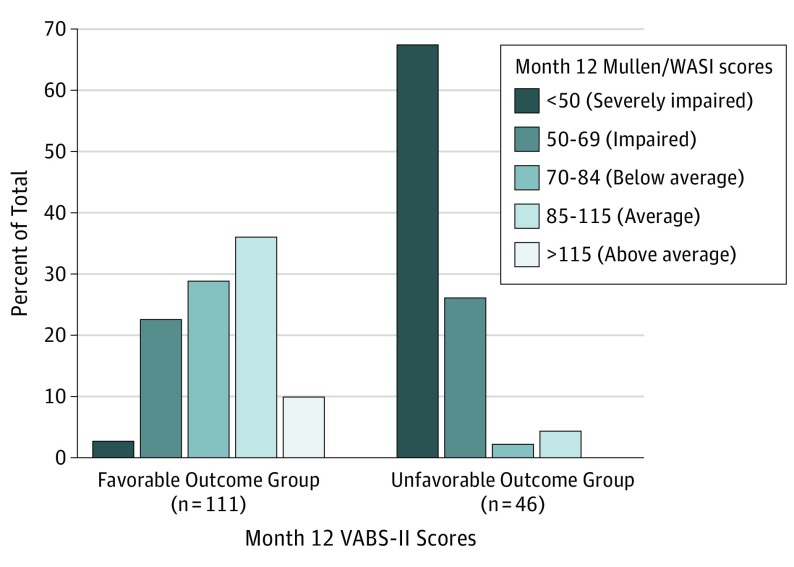
Figure. Distributions of Cognitive Composite Scores (Early Learning Composite From Mullen or 2-Subtest WASI IQ Composite) for Favorable and Unfavorable Outcome Groups.
Mullen indicates Mullen Scales of Early Learning; VABS-II, Vineland Adaptive Behavior Scales, Second Edition; and WASI indicates Wechsler Abbreviated Scale of Intelligence.

