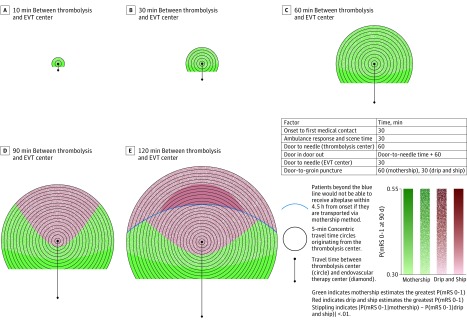
Figure 2. Transport Decision Making in a System With Slow Treatment Times at the Thrombolysis Center.
Two-dimensional temporal spatial diagrams depicting transport decision making for patients with suspected ischemic stroke with large-vessel occlusion, defined as Los Angeles Motor Scale Score of 4 or higher, in a system with slow treatment times at the thrombolysis center. The diagrams depict a single thrombolysis center in the middle of the Figure, depicted with a circle, and an endovascular therapy (EVT) center, depicted by a diamond, at travel times of 10 (A), 30 (B), 60 (C), 90 (D), and 120 (E) minutes below it. There are 5-minute concentric travel time circles radiating from the thrombolysis center. Red indicates areas where drip and ship estimates the greatest probability of excellent outcome and green indicates areas where mothership estimates the greatest probability of excellent outcome. White stippling indicates areas where the optimal transport method supersedes the other by 1% or less. Area where the patient is closest to the EVT center is not shown because the mothership option is always best in this scenario. The degree of color saturation reflects the value of the probability of excellent outcome. The blue line represents the point where the onset to needle time in the mothership scenario is more than 270 minutes.

