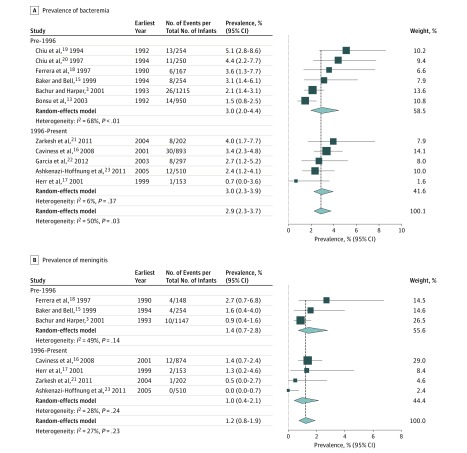
Figure 3. Meta-analysis of Prevalence of Bacteremia and Meningitis in Febrile Neonates in the First Month of Life.
For each subgroup, the sum of the statistics, along with the summary prevalence, is represented by the middle of the solid diamonds. The width of the diamonds represents summary 95% CIs; squares represent mean values, with error bars representing 95% CIs.

