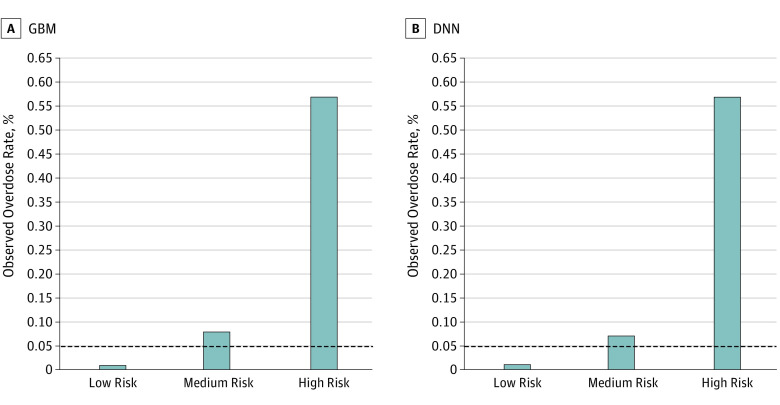
Figure 2. Calibration Performance of Gradient Boosting Machine (GBM) and Deep Neural Network (DNN) by Risk Group.
Risk subgroups were classified into 3 groups using the optimized threshold in the validation sample (n = 186 686): low risk (score below the optimized threshold), medium risk (predicted score between the optimized threshold, identified by the Youden index, and the top fifth percentile score), and high risk (predicted score in the top fifth percentile). The dashed line indicates the overall observed overdose rate without risk stratifications.

