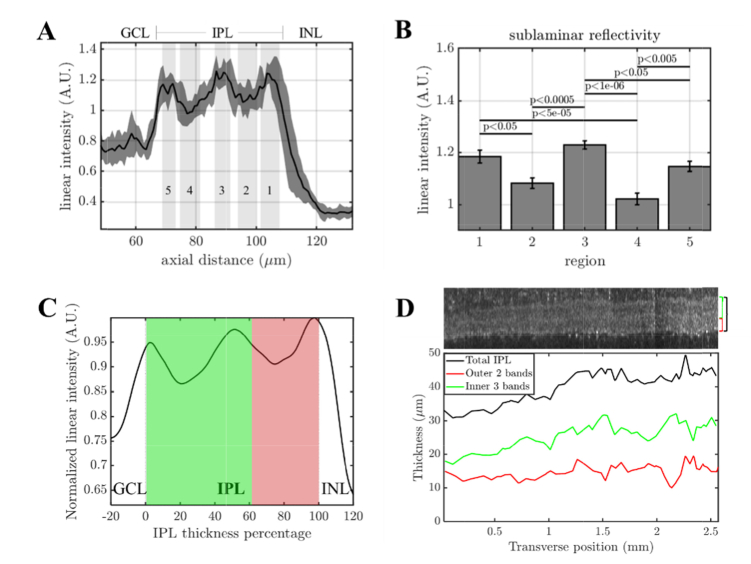
Fig. 6.
Inner retinal morphometry and lamination in the inner plexiform layer (IPL) with visible light OCT. (A) The average linear signal intensity profile of the inner retina. The solid black line is the mean value over a 1.5 mm field-of-view, while the gray shaded region indicates the standard deviation over ~0.15 mm transverse regions. (B) IPL lamination is clearly visualized, with statistically significant differences in reflectivity between bands (ANOVA with Tukey’s Honest Significant Difference). (C) To account for IPL thickness changes over the 2.6 mm field-of-view, the normalized intensity is plotted versus IPL thickness percentage. The on sublamina (green) exhibits deeper troughs in band 4 than the off sublamina (red) does in band 2. (D) As the IPL thickness changes, the outer 2 bands (off sublamina) and inner 3 bands (on sublamina) appear to change in proportion.

