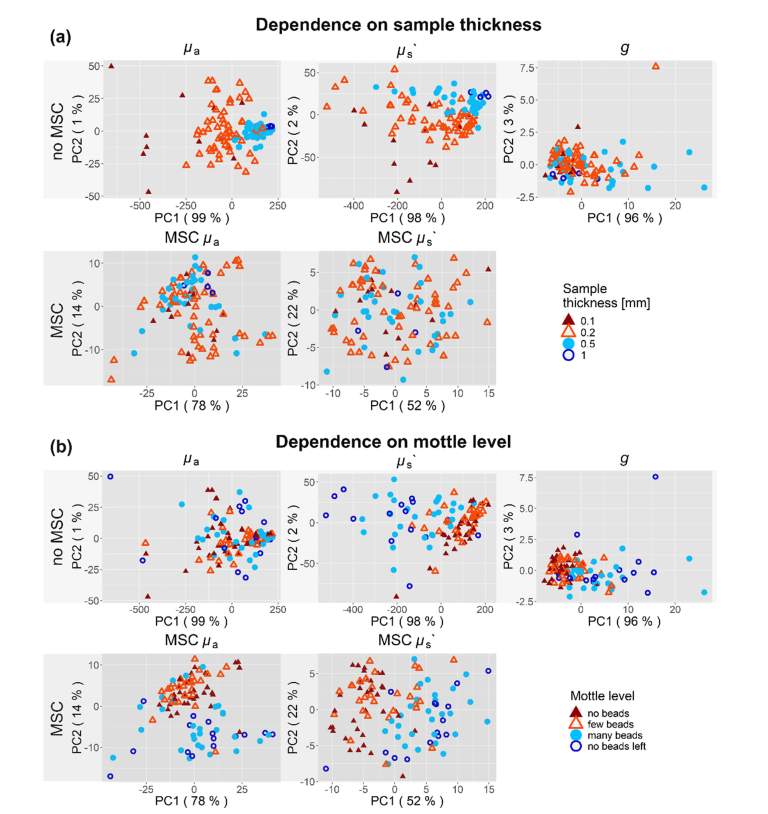
Fig. 2.
PCA of all 107 stool spectra, with and without MSC. The scores are shown for the first two PCs for µa, µs’ and g. (a) The sample thickness and (b) mottle level of the stool are presented with colors. (a) The color coding varies from red to blue with increasing thickness. Humid stool probes were more transparent and hence data from thicker cuvettes more likely to be included. MSC removes the influence on sample thickness in PCA as shown in the lower subplots, effectively removing the influence of varying water content. (b) Meconium entails the probes with zero up to few beads, colored in dark and light red. Transitional stool probes contain many beads or have no more beads left, they are shown in light and dark blue. MSC uncovers the influence of the mottle level on PCA in µa as seen in the bottom left subplot.

