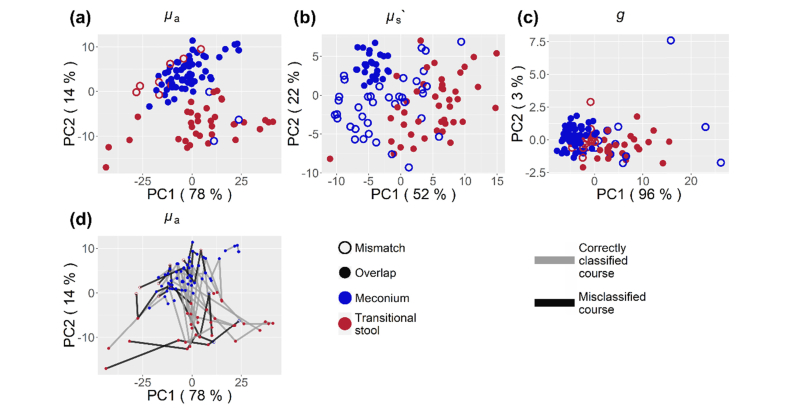
Fig. 3.
PCA of all 107 MSC stool µa, µs’ and g spectra (a,b and c). A probabilistic cluster analysis was carried out on the scores of the first two principal components (PC), delivering two clusters for each property. In case of the µa spectra, these clusters coincide for 90% of all stool probes with the classification of stool into meconium (blue) and transitional stool (red). Following the development of µa from meconium to transitional stool, the clustering predicts a correct course for 17 out of 25 children (d).

