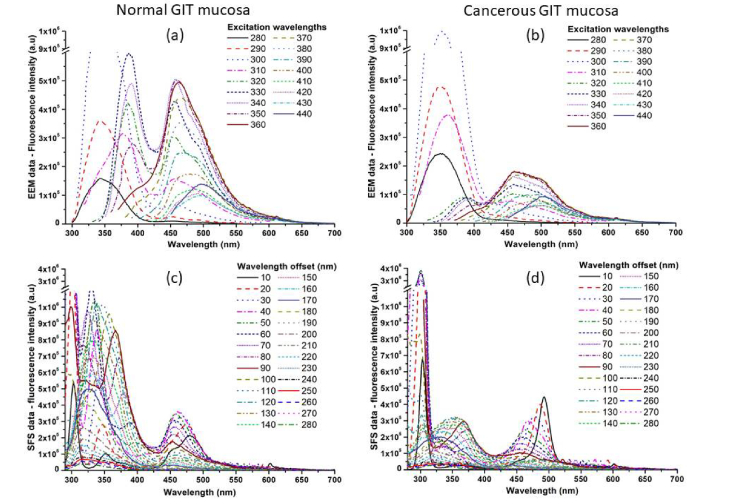
Fig. 1.
Excitation–emission spectral data of normal (a) and cancerous (b) GIT mucosa for excitation range from 280 to 440 nm and synchronous fluorescence spectral data of normal (c) and cancerous (d) GIT mucosa for spectral offset varying from 10 to 200 nm between excitation and emission spectra respectively.

