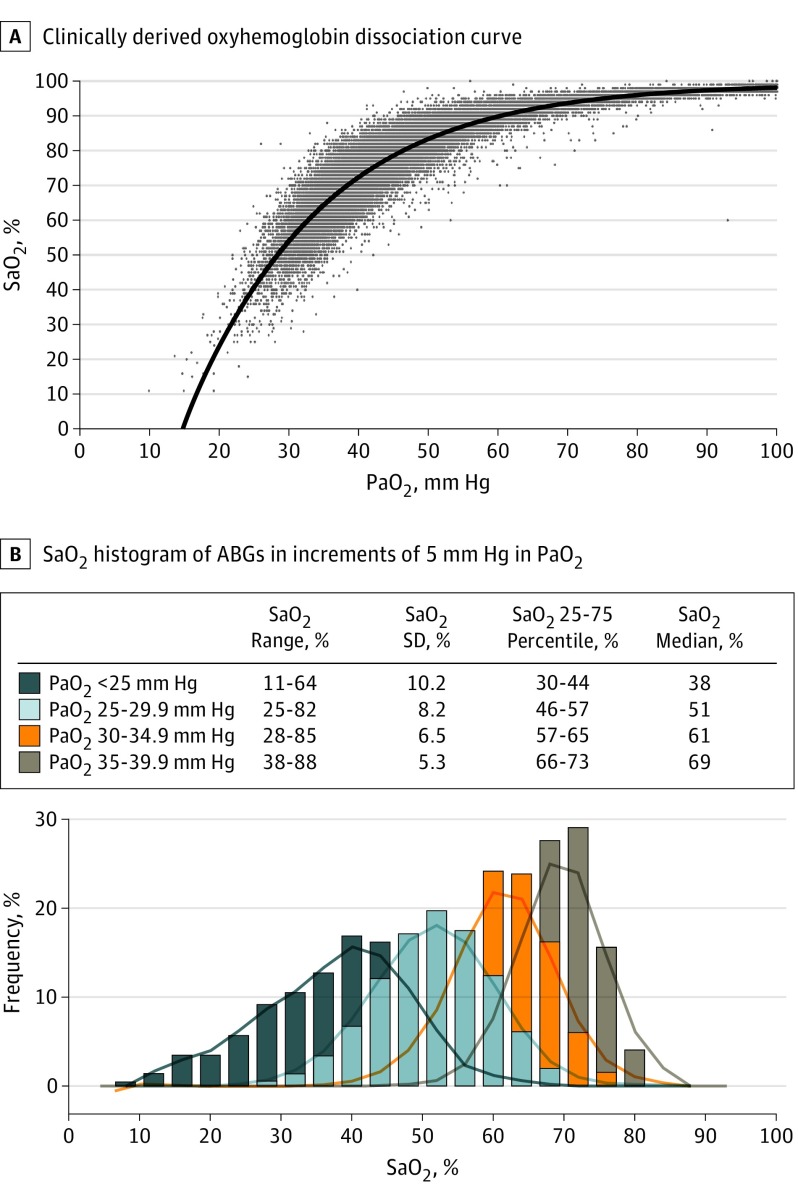
Figure 1. Clinically Derived Oxyhemoglobin Dissociation Curve and Variance of Oxyhemoglobin Saturation (Sao2) Within Narrow Arterial Oxygen Tension (Pao2) Increments.
A, Pao2 and Sao2 become increasingly variant as Pao2 decreases. B, Within the actionable range of hypoxemia, Sao2 correlates progressively less closely with Pao2 as Pao2 decreases. Note the increasingly broad ranges and SDs of Sao2 within progressively decreasing increments of 5 mm Hg in Pao2. ABGs indicates arterial blood gases.

