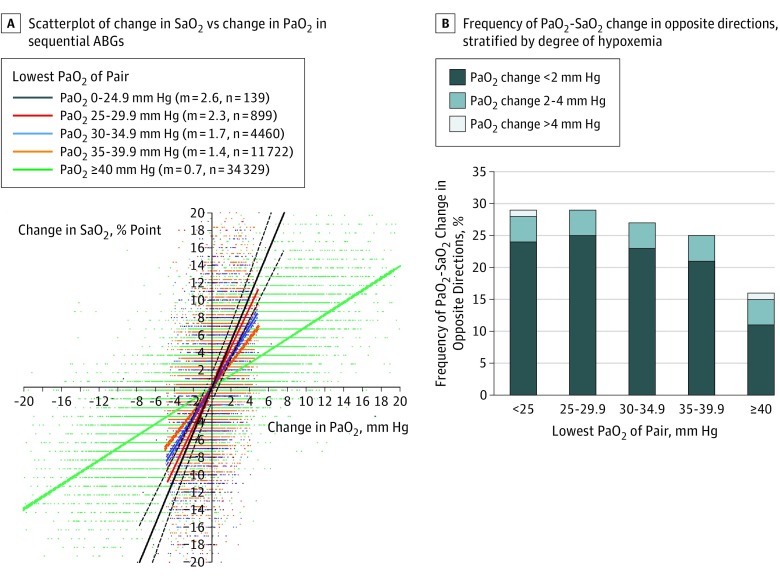
Figure 2. Relationship Between Changes in Oxyhemoglobin Saturation (Sao2) and Changes in Arterial Oxygen Tension (Pao2) in Serial Arterial Blood Gases (ABGs).
A, The relationship between changes in Sao2 and Pao2 on sequential ABGs are shown, stratified by the lowest Pao2 of the pair. Slopes of linear regression lines (m) increase with increasing hypoxemia (P < .001). The lines indicate linear regression ±95% CI. B, The frequency of opposite changes in Pao2 and Sao2 was stratified by degree of hypoxemia.

