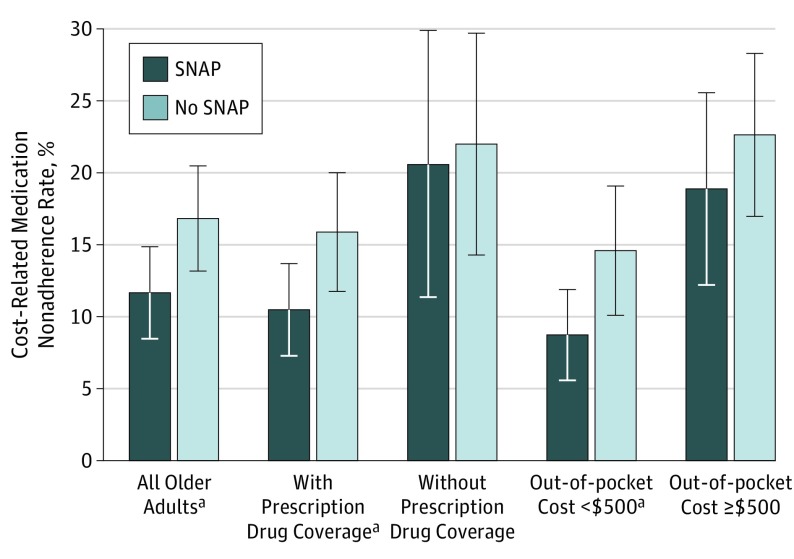
Figure 2. Regression-Adjusted Cost-Related Medication Nonadherence Rates for Older Adults With Diabetes Who Did and Did Not Participate in SNAP.
Estimated cost-related medication nonadherence rates include a constant and other covariates from Table 2, and are weighted by the product of the propensity score weight and survey weight. Prescription drug coverage subgroup models omit drug coverage as a covariate, and out-of-pocket cost subgroup models omit out-of-pocket costs as a covariate. The percentage point difference between the cost-related medication nonadherence rates for the treatment and comparison groups represents the population average treatment effect on the treated. SNAP indicates Supplemental Nutrition Assistance Program. Error bars show the 95% CIs.
aStatistically significant population average treatment effect on the treated values at P < .05.

