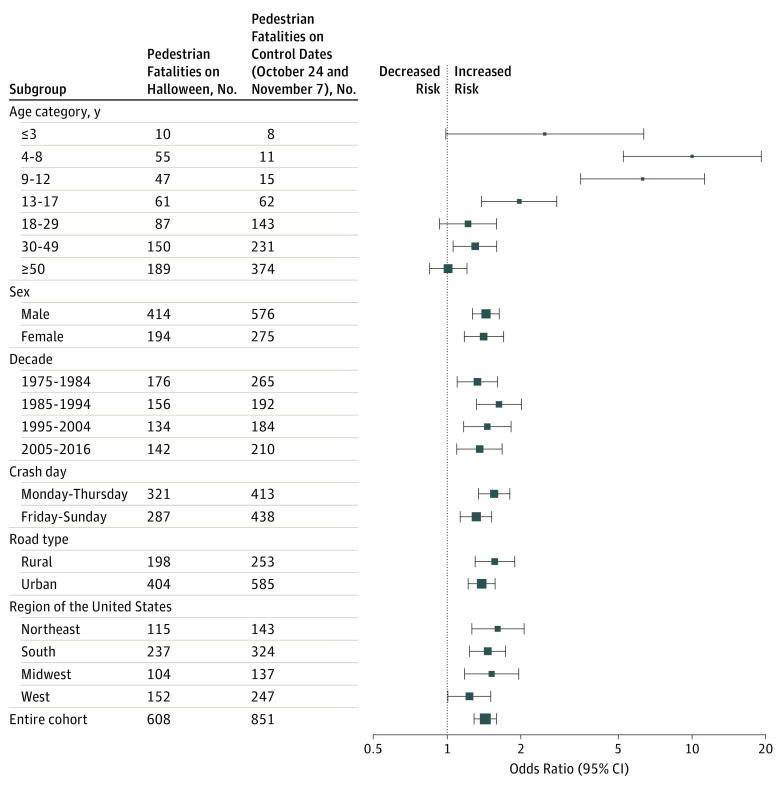
Figure 1. Relative Risk of Pedestrian Fatality on Halloween Compared With Control Dates.
Forest plot showing the relative risk of pedestrian fatality between 5 pm and 11:59 pm on Halloween compared with the same time interval on control evenings exactly 1 week earlier and 1 week later. Solid squares indicate point estimate; relative dimensions, sample size; horizontal lines, 95% CIs.

