
Figure 4.
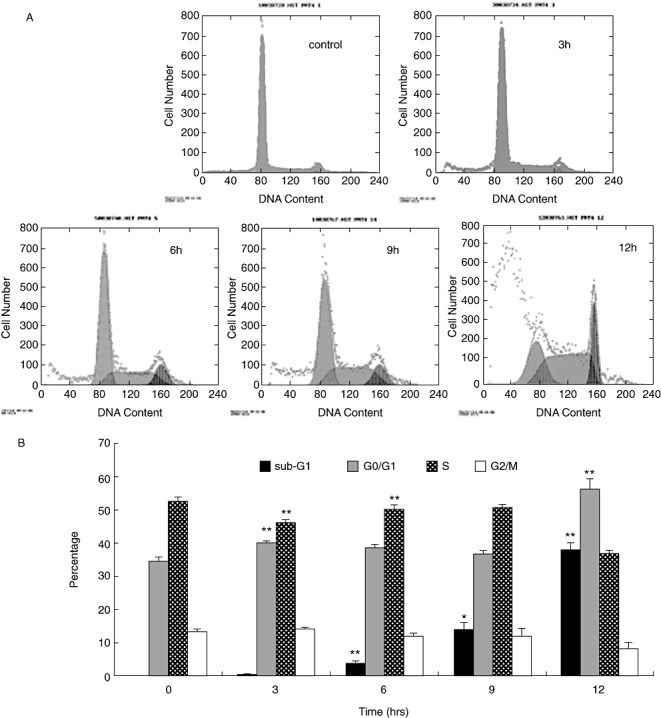
(A) Cells were treated with 50 µM curcumin for the indicated times, then harvested and subjected to analysis of the DNA content by flow cytometry. (B) U2OS cells were incubated with curcumin for various periods of time and the results of independent experiments are presented in figure form showing percentages (± SD) of cells in each phase of the cell cycle. G1 arrested the effects of curcumin. Data from five independent experiments is presented as mean ± SD. *P < 0.01; **P < 0.001; compared with control. FCM, effects of curcurmin; G1, S, G0/G1 and G2/M, phases of the cell cycle.