
Figure 6.
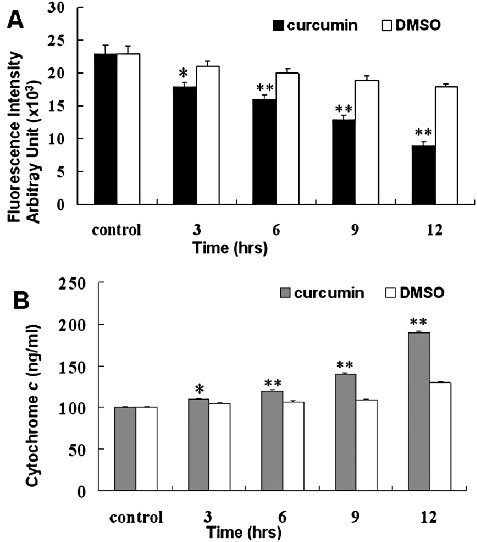
Measurement of mitochondrial membrane potential and cytoplasmic cytochrome c release in U2OS cells during curcumin treatment. (A) U2OS cells were treated with 10 µM rhodamine 123 for 10 min prior to incubation with curcumin and then cells were incubated with or without 50 µM curcumin for various periods of time. At the end of incubation, mitochondrial membrane potential was measured as described in Materials and Methods. (B) U2OS cells were incubated with or without 50 µM of curcumin for the indicated time. Cytoplasmic cytochrome c release was determined by immunoassay as described in Materials and Methods. The data are expressed as mean ± SD of five determinations, *P < 0.01 and **P < 0.001 compared to DMSO treated group.