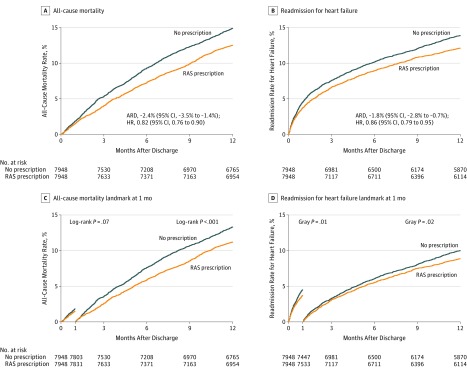
Figure 2. Kaplan-Meier Curves and Landmark Analysis for Mortality and Cumulative Incidence Curves for Heart Failure Readmission.
The median observation time in panel A was 4.7 months (95% CI, 4.2-5.1 months) for no prescription and 5.0 months (95% CI, 4.5-5.5 months) for prescription of an renin-angiotensin system (RAS) inhibitor; panel B, 2.4 months (95% CI, 2.0-6.8 months) vs 2.6 months (95% CI, 2.1-8.0 months), respectively; panel C, 5.3 months (95% CI, 4.9-5.7 months) vs 5.6 months (95% CI, 5.2-6.1 months); and panel D, 4.8 months (95% CI, 4.2-5.7 months) vs 4.6 months (95% CI, 4.0-6.7 months). The landmark analyses were conducted post hoc. Only patients without events at 1 month were considered in the analysis after the landmark time point (panels C and D). ARD indicates absolute risk difference; HR, hazard ratio.

