
Figure 1.
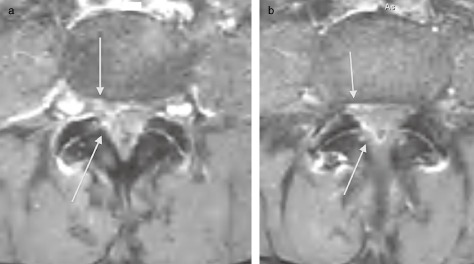
(a) Axial T 1 weighted post contrast image displaying increased enhancement adjacent to the ligamentum flavum of the L 4–5 level and on the right ventral epidural space (arrows). (b) Axial T 1 weighted post contrast image (1 mm caudal to Fig. 1a) displaying increased enhancement in the right epidural space both ventral and dorsal to the thecal sac (arrows).