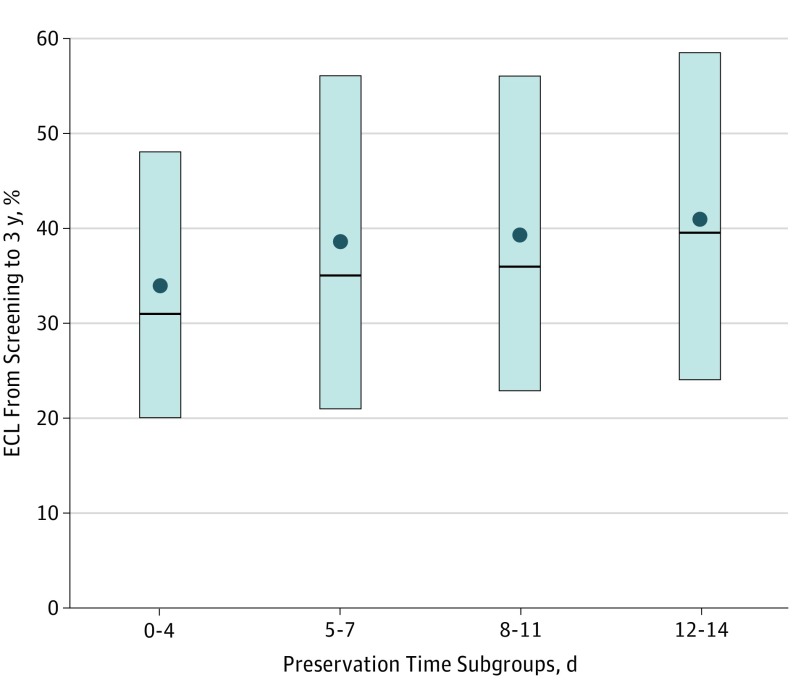
Figure 3. Percentage of Endothelial Cell Loss (ECL) From Baseline Screening at 3 Years, by Preservation Time Subgroup for Participants With Graft Success and a Gradable Image at 3 Years.
The upper and lower edges of each box represent the interquartile range (25th-75th percentile). The circle in each box is the mean and the line inside each box is the median.

