Figure 3.

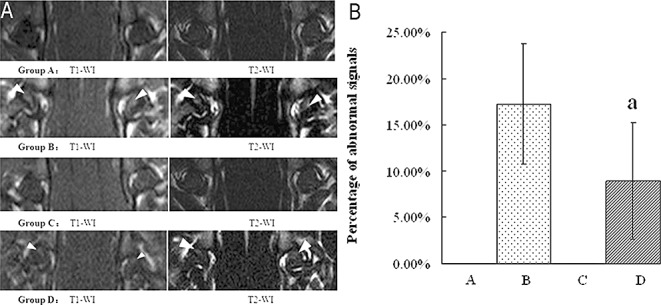
MRI images of the femoral heads, white arrows denote ONFH. (A) MRI images. Group A: abnormal signals were not detected on T1‐WI or on T2‐WI in any rats. Group B: the area of abnormal signals on T1‐WI and T2‐WI is clearer and larger than that in Group D. Group C: abnormal signals were not detected on T1‐WI or on T2‐WI in any rats. Group D: the area of abnormal signals on T1‐WI and T2‐WI in Group D is smaller than that in Group B. (B) Percentage area of abnormal signals. Abnormal signals were detected neither in Group A nor in Group C. Results are expressed as mean ± SD. a, P < 0.01 relative to Group B.
