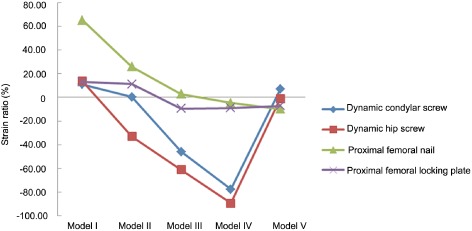
Figure 4.

Comparison of strain ratios of all fracture models with different internal fixations on no. 3 strain gauge (n = 32). The differences among models I, II and III in PFN group were statistically significant. There were no significant differences in strain ratios among the models in the PFLP group. The strain ratios of DCS and DHS were significantly different in models II–IV.
