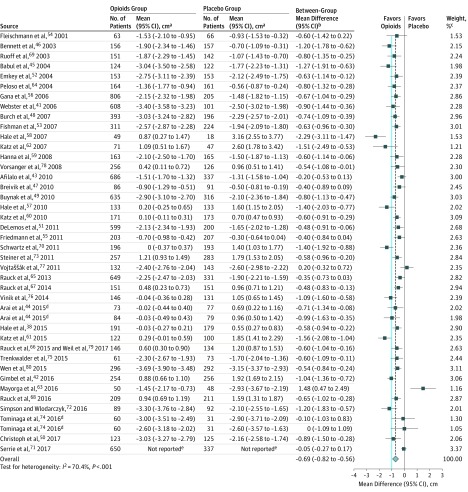
Figure 2. Pain Relief on a 10-cm Visual Analog Scale Among Patients With Chronic Noncancer Pain Who Received Opioids vs Placebo in 42 High-Quality Randomized Clinical Trials.
The blue line represents the minimally important difference of 1 cm on the 10-cm visual analog scale for pain. The dashed vertical line represents the overall pooled measure of association.
aWithin-group change from baseline data.
bBetween-group differences in change from baseline data.
cWeights are from random-effects analyses.
dArticle reported results from 2 randomized clinical trials.
eArticle only reported between-group mean difference and 95% CI.

