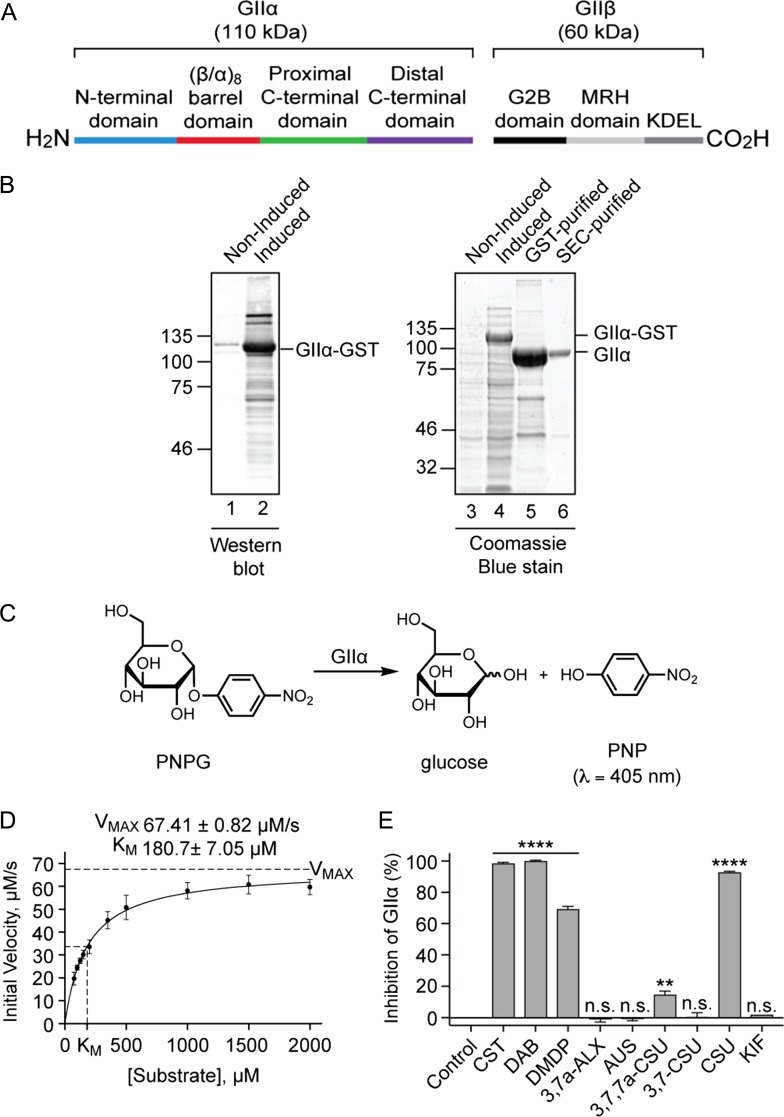
Figure 5.
The effect of compounds on α-glucosidase II enzyme activity. (A) ER α-Glu II is a heterodimeric enzyme consisting of the catalytic GIIα subunit (110 kDa) and a non-catalytic regulatory GIIβ subunit (60 kDa). The active site of GIIα is located in its (β/α)8 barrel domain (Caputo et al. 2016; Satoh et al. 2016). The GIIβ subunit contains an N-terminal GIIα-binding domain (G2B), a mannose-6-phosphate receptor homology (MRH) domain involved in N-glycan recognition and a KDEL ER-retention signal (Olson et al. 2013; Caputo et al. 2016). (B) A C-terminally GST-tagged version of Chaetomium thermophilum GIIα lacking the signal sequence (Satoh et al. 2016) was expressed in E. coli (western blot using anti-GST, lanes 1–2; Coomassie Blue staining, lanes 3–4; see GIIα-GST). Following cell lysis, recombinant protein was purified using a Glutathione-Sepharose Column and GIIα released by on-column cleavage with tobacco etch virus (TEV) protease (lane 5), followed by size exclusion chromatography (SEC) (lane 6). (C) A schematic depicting the calorimetric reaction used to measure GIIα inhibition. GIIα-catalyzed cleavage of p-nitrophenyl-α-D-glucopyranoside (PNPG) produces glucose and yellow p-nitrophenol (PNP). The amount of PNP liberated during the course of the reaction was monitored by absorbance measurements. (D) Different concentrations of PNPG (ranging from 75 μM to 2 mM) were incubated with GIIα (6 μg/mL) at 37°C and absorbance measurements (λ = 410 nm, 1 min intervals, 90 min) used to generate a substrate-velocity curve. Using the Michaelis-Menten model, values for VMAX (67.41 ± 0.82 μM/s) and KM (180.7 ± 7.05 μM) were estimated (n = 12, R2 0.9534). (E) Compounds at 100 μM were incubated with 125 μM PNPG and 6 μg/mL GIIα at 37°C and absorbance measurements (λ = 410 nm, 1 min intervals, 90 min) used to calculate the % inhibition of GIIα relative to control reactions. Assays were performed in triplicate (n = 3) and statistical significance (one-way ANOVA) determined using Tukey’s multiple comparisons test. Statistical significance is given as n.s., non-significant; **, P < 0.01 and ****, P < 0.0001.

